What is a Futures Chart? A Beginner’s Guide to Understanding Market Trends
A futures chart is one of the most powerful tools available to traders. It visually represents the price movements of futures contracts over a specific period, allowing traders to identify trends, patterns, and potential trading opportunities. If you are new to futures trading, understanding how these charts work is the first step towards making informed decisions in the market.
What is a Futures Chart?
A futures chart is a graphical representation of the price action of a futures contract. Futures contracts are agreements to buy or sell an asset at a future date for a predetermined price. These charts help traders see how the price has changed over time, typically displayed in line, bar, or candlestick formats.
Key Components of a Futures Chart
- Time Axis (X-Axis): Shows the timeline of the price data, which can range from minutes to years.
- Price Axis (Y-Axis): Displays the price levels of the futures contract.
- Chart Type: Can be line, bar, or candlestick. Each type provides different levels of detail.
- Volume Indicators: Some charts also include volume data to show how much of the contract has been traded.
- Technical Indicators: Traders often overlay tools like moving averages, RSI, or MACD for deeper analysis.
Types of Futures Charts
- Line Charts: Simple and ideal for beginners. They plot the closing prices over time.
- Bar Charts: Show the opening, closing, high, and low prices for each time period.
- Candlestick Charts: Similar to bar charts but more visually intuitive, popular among technical traders.
Why Futures Charts Matter
Futures charts allow traders to:
- Spot trends – whether prices are generally moving up, down, or sideways.
- Identify support and resistance levels – key areas where prices might bounce or break through.
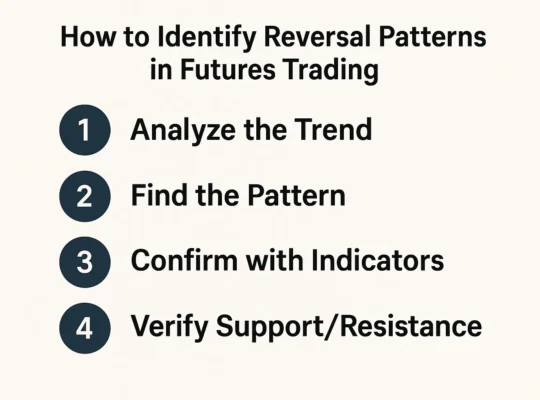
- Analyze patterns – recurring price formations that can indicate potential future movements.
- Plan trades – by using historical data to forecast possible price action.
Common Uses of Futures Charts
- Day Trading: Using short timeframes (1-min, 5-min charts) for quick trades.
- Swing Trading: Analyzing daily charts for trades lasting several days or weeks.
- Hedging: Businesses use futures charts to manage price risk in commodities like oil or wheat.
Where to Access Futures Charts
Many platforms provide access to real-time or historical futures charts. Popular free options include:
- TradingView
- Finviz
- Barchart
- CNBC Futures Section
Paid platforms offer more advanced features, including deep technical analysis tools.
Conclusion
Understanding what a futures chart is and how to read it is essential for anyone interested in trading futures. As a beginner, focus on line or candlestick charts and gradually explore more advanced tools. Futures charts help you make sense of market movements and give you the insight needed to make more informed trading decisions.
FAQs
1. What is the purpose of a futures chart?
A futures chart helps traders analyze the price movements of futures contracts over time, enabling them to identify trends, patterns, and potential trade opportunities.
2. Which type of chart is best for beginners?
Line charts are best for beginners due to their simplicity. They show only closing prices, making it easy to understand basic price trends.
3. Are futures charts updated in real time?
Yes, many platforms offer real-time futures charts, especially for active traders. Free platforms like TradingView and CNBC provide live data with slight delays.
4. Can I trade directly from a futures chart?
Some advanced trading platforms allow you to execute trades directly from the chart interface, integrating chart analysis with order placement.
5. What timeframes are used in futures charts?
Futures charts can display various timeframes, from 1-minute intervals for day traders to weekly or monthly charts for long-term analysis.