Daily futures charts are one of the most powerful tools for traders looking to analyze market trends, identify trading opportunities, and make informed decisions. While shorter timeframes cater to intraday traders, daily charts offer a clearer view of the market’s overall direction, helping traders spot key support, resistance, and trend levels.
This guide will show you how to effectively use daily futures charts in your trading strategy.
What is a Daily Futures Chart?
A daily futures chart displays the price action of a futures contract with each candlestick or bar representing one trading day. These charts are widely used by:
- Swing traders looking to hold positions for days or weeks.
- Position traders who analyze broader trends.
- Traders seeking less noise than intraday charts.
Benefits of Using Daily Futures Charts
- Clear Trend Identification: Less market noise compared to intraday charts.
- Key Levels Visibility: Easily spot support, resistance, and breakout points.
- Better Risk Management: Wider stop-loss levels help avoid being stopped out by intraday volatility.
- Time-Efficient: Requires less screen time than lower timeframes.
How to Analyze Daily Futures Charts
1. Identify the Trend
- Uptrend: Higher highs and higher lows.
- Downtrend: Lower highs and lower lows.
- Use tools like Moving Averages (MA) to confirm trend direction.
2. Key Support and Resistance Levels
- Look for historical price levels where price reversed.
- Plot horizontal lines at daily highs and lows.
3. Candlestick Patterns to Watch
- Bullish Patterns:
- Hammer
- Morning Star
- Bullish Engulfing
- Bearish Patterns:
- Shooting Star
- Evening Star
- Bearish Engulfing
4. Volume Analysis
- High volume on up days signals strong buying interest.
- High volume on down days indicates selling pressure.
5. Use Technical Indicators
- RSI (Relative Strength Index): Identify overbought (>70) or oversold (<30) conditions.
- MACD: Spot momentum shifts and trend changes.
- Bollinger Bands: Detect volatility and price extremes.
Trading Strategies Using Daily Futures Charts
1. Trend Following
- Enter trades in the direction of the main trend.
- Use moving averages (50-day, 200-day) to guide entries.
2. Breakout Trading
- Watch for price breaking above resistance or below support.
- Confirm breakouts with increased volume.
3. Swing Trading
- Use daily charts to plan trades that last several days.
- Set profit targets based on previous swing highs/lows.
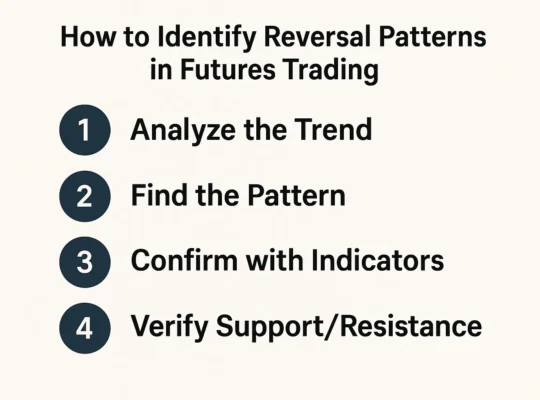
4. Reversal Trading
- Identify overextended moves and look for reversal candlestick patterns.
- Combine with RSI or MACD divergence for confirmation.
Example: Daily Chart Analysis of Crude Oil Futures
- Trend: Uptrend with price above the 50-day MA.
- Support: $74 zone.
- Resistance: $82 zone.
- Strategy: Buy on pullbacks to support with stop-loss below $72.
Conclusion
Daily futures charts provide a solid foundation for traders seeking to analyze market trends, set strategic entries, and manage trades effectively. Whether you are trading commodities, indices, or currencies, daily charts help you avoid the noise of lower timeframes while capturing meaningful price movements.
FAQs about Daily Futures Charts
1. Are daily futures charts good for beginners?
Yes, daily charts are easier to analyze and less stressful than intraday charts.
2. How many candles are on a daily futures chart?
It depends on the time span you choose. A 3-month daily chart shows approx. 60 candles.
3. Can I day trade using daily futures charts?
Daily charts are better for swing or position trading, but can help confirm broader trends for day traders.
4. What’s the best indicator for daily charts?
Moving Averages, RSI, and MACD are widely used on daily charts.
5. Which platforms offer daily futures charts?
TradingView, Barchart, Investing.com, and most broker platforms.