Understanding how to read futures charts is crucial for traders aiming to analyze market movements and make informed decisions. Whether you’re a beginner or looking to sharpen your skills, learning to interpret line, bar, and candlestick charts will give you a solid foundation in technical analysis.
What Are Futures Charts?
Futures charts display the price of futures contracts over time. These charts provide insight into historical price movements, helping traders predict future price actions. Futures charts can be represented in different formats, each offering unique advantages.
Types of Futures Charts and How to Read Them
1. Line Charts
What It Is:
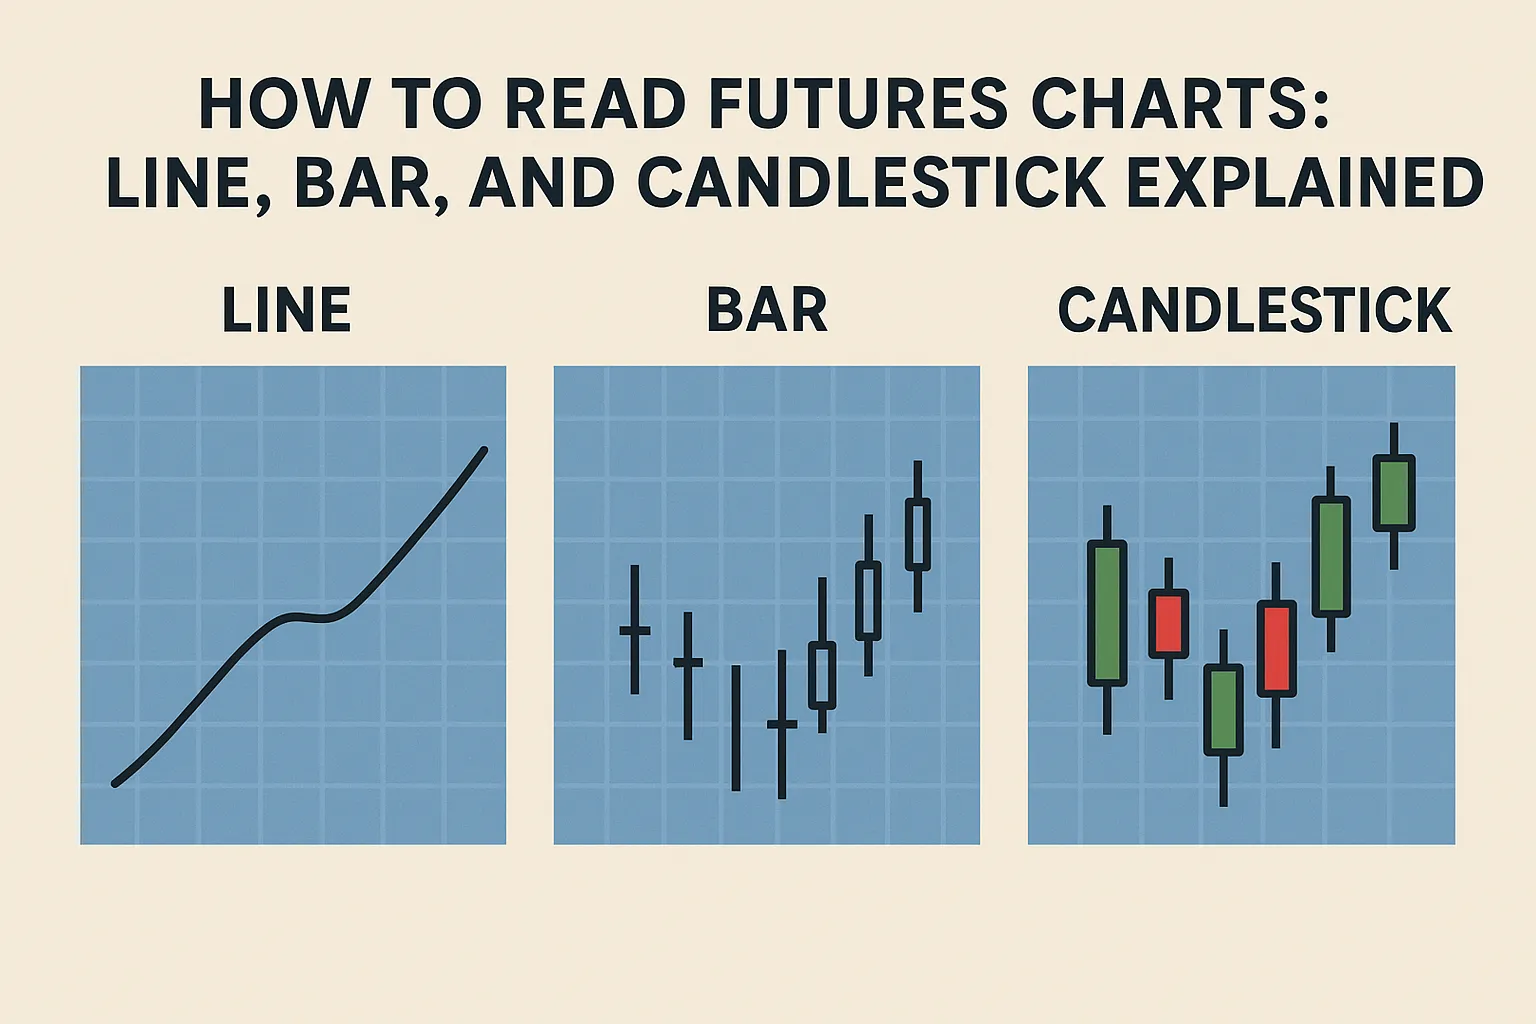
A line chart is the simplest type of futures chart, plotting the closing prices of a contract over time and connecting them with a continuous line.
How to Read It:
- Focuses only on closing prices.
- Best for identifying long-term trends.
- Easy for beginners due to its simplicity.
Use Case:
Ideal for getting a quick overview of the general price direction of a futures contract.
2. Bar Charts
What It Is:
A bar chart provides more detail by showing the opening, high, low, and closing prices (OHLC) for each time period.
How to Read It:
- The vertical line represents the range between the high and low prices.
- A small horizontal line to the left indicates the opening price.
- A small horizontal line to the right shows the closing price.
Use Case:
Bar charts are used to understand daily price fluctuations and short-term trading opportunities.
3. Candlestick Charts
What It Is:
Candlestick charts are a visual and more intuitive version of bar charts, displaying the same OHLC data but in a color-coded format.
How to Read It:
- The body of the candle shows the range between the open and close.
- The wicks (shadows) represent the high and low of the period.
- A green/white candle means the price closed higher than it opened.
- A red/black candle means the price closed lower than it opened.
Use Case:
Candlestick patterns provide insights into market sentiment and are widely used in technical analysis.
Choosing the Right Chart for Futures Trading
- Line Charts: Great for beginners and long-term trend analysis.
- Bar Charts: Useful for traders focusing on price ranges and volatility.
- Candlestick Charts: Best for detailed analysis and spotting specific market patterns.
Reading Chart Timeframes
Futures charts can be read over various timeframes:
- Intraday Charts (1-min, 5-min): For day traders.
- Daily Charts: For swing traders.
- Weekly/Monthly Charts: For long-term investors.
Choosing the right timeframe depends on your trading strategy and goals.
Common Indicators Used with Futures Charts
While reading charts, traders often overlay indicators for better analysis:
- Moving Averages
- Relative Strength Index (RSI)
- MACD (Moving Average Convergence Divergence)
These help confirm trends and signal entry or exit points.
Conclusion
Learning to read futures charts is an essential skill for anyone involved in futures trading. Whether you prefer the simplicity of line charts, the detail of bar charts, or the visual power of candlesticks, each chart type has its place in a trader’s toolkit. Start with one format, master it, and then expand your analysis by incorporating other chart types and technical indicators.
FAQs about Reading Futures Charts
1. Which futures chart type is best for beginners?
Line charts are best for beginners due to their simplicity and focus on closing prices.
2. What is the difference between bar and candlestick charts?
Both show OHLC data, but candlestick charts are more visual, with color-coded bodies making trends easier to spot.
3. Can I switch between chart types on trading platforms?
Yes, most trading platforms like TradingView and Finviz allow easy switching between chart types.
4. How do I know which timeframe to use for reading charts?
It depends on your trading style—short timeframes for day trading, longer ones for swing or position trading.
5. Are candlestick patterns reliable for futures trading?
Yes, candlestick patterns are widely used and can be effective, especially when combined with other indicators.