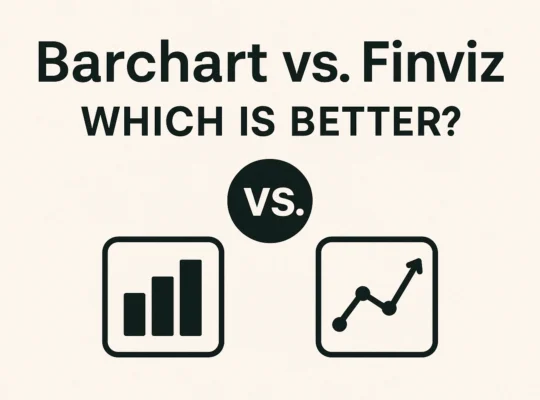
Finviz is a well-known financial visualization platform that offers a range of tools for market analysis, including futures charts. Whether you are tracking commodities, indices, or financial futures, Finviz futures charts provide an easy-to-use interface for quick insights into market trends.
In this guide, we’ll explore how to use Finviz to access futures data and perform effective analysis, even if you’re just starting out.
Why Use Finviz for Futures Charting?
- Free access to futures market overviews.
- Heatmaps and charts to quickly assess market sentiment.
- User-friendly design suitable for beginners and advanced traders.
- Covers a variety of futures including commodities, indices, and currencies.
Accessing Futures Charts on Finviz
Step 1: Visit Finviz Futures Page
- Go to finviz.com/futures.ashx
- This page shows an overview of major futures markets including commodities like gold, oil, and wheat, along with indices and currencies.
Step 2: Explore the Futures Heatmap
- The heatmap gives a color-coded snapshot of the market.
- Green: Futures are up.
- Red: Futures are down.
- This allows traders to see which contracts are trending at a glance.
Step 3: View Detailed Futures Charts
- Click on any futures contract (e.g., ES, CL, GC) from the heatmap or list.
- This opens a detailed chart showing recent price trends.
- Charts include:
- Line format (default).
- Key technical levels (support/resistance).
- Basic indicators.
Step 4: Analyze Key Market Data
- Quote data includes:
- Last price
- Change (%)
- Open, High, Low
- Volume
- News integration: Finviz links relevant news headlines for deeper analysis.
Key Features of Finviz Futures Charts
- Clean interface – Minimalist design for fast access.
- Heatmaps – Quick market sentiment overview.
- Market snapshots – Access futures quotes, charts, and news in one place.
- Sector performance – Understand how different futures sectors are performing.
Limitations of Finviz for Futures
- Chart customization is limited compared to platforms like TradingView.
- Delayed data for free users (typically 15-20 minutes).
- No advanced indicators or drawing tools.
Ideal Use Cases for Finviz Futures Charts
- Quick Market Scans: Get a fast overview of which futures are moving.
- Supplementary Analysis: Use Finviz alongside more detailed charting tools.
- Beginner-Friendly Insights: Ideal for traders who want simple visualizations.
Conclusion
Finviz futures charts are perfect for traders who need a quick and easy way to monitor futures markets. While it lacks advanced charting tools, it excels at providing a high-level view of market trends, supported by useful data and news integration. Use Finviz to complement your futures analysis and make faster decisions based on real-time market sentiment.
FAQs about Finviz Futures Charts
1. Is Finviz free for futures charting?
Yes, Finviz offers free access to basic futures charts and market data. More advanced features require Finviz Elite.
2. Does Finviz provide real-time futures data?
No, futures data is delayed for free users. Real-time data is available with a Finviz Elite subscription.
3. Can I perform technical analysis on Finviz futures charts?
Finviz charts offer limited technical analysis features. For detailed analysis, use platforms like TradingView.
4. What types of futures can I view on Finviz?
You can view commodity, index, and currency futures including gold, oil, S&P 500, and USD futures.
5. Is Finviz suitable for beginners?
Yes, its user-friendly interface makes it ideal for beginners looking for quick market insights.