One of the most important questions futures traders ask is, “Is the market bullish or bearish?” Understanding futures market sentiment is key to making informed trading decisions. By analyzing charts, patterns, and indicators, traders can assess whether the market is more likely to rise or fall.
This guide explains how to identify bullish and bearish signals in futures charts and interpret market sentiment effectively.
What is Market Sentiment?
Market sentiment refers to the overall attitude of traders and investors toward a particular market or asset. In futures trading:
- Bullish Sentiment: Traders expect prices to rise.
- Bearish Sentiment: Traders expect prices to fall.
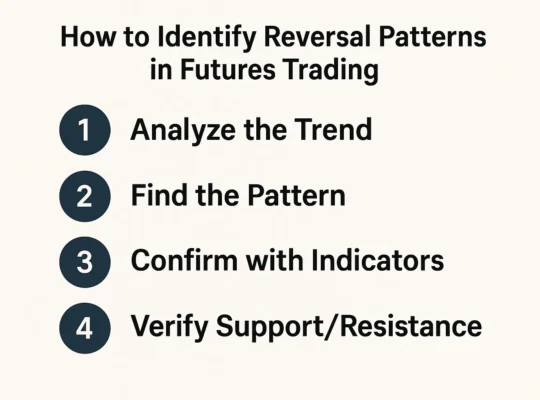
How to Read Bullish and Bearish Sentiment in Futures Charts
1. Price Trends
- Uptrend (Bullish): Higher highs and higher lows.
- Downtrend (Bearish): Lower highs and lower lows.
Use trendlines to visualize direction.
2. Moving Averages
- Bullish Signal: Price above the 50-day and 200-day moving averages.
- Bearish Signal: Price below key moving averages.
Golden Cross: 50-day MA crosses above 200-day MA (bullish).
Death Cross: 50-day MA crosses below 200-day MA (bearish).
3. Relative Strength Index (RSI)
- Above 70: Market is overbought (potential bearish reversal).
- Below 30: Market is oversold (potential bullish reversal).
4. Candlestick Patterns
- Bullish Patterns:
- Hammer
- Bullish Engulfing
- Morning Star
- Bearish Patterns:
- Shooting Star
- Bearish Engulfing
- Evening Star
5. Volume Analysis
- Rising Volume + Rising Price: Confirming bullish sentiment.
- Rising Volume + Falling Price: Confirming bearish sentiment.
6. Commitment of Traders (COT) Report
- Shows positions of large traders.
- Net long positions suggest bullish sentiment.
- Net short positions indicate bearish expectations.
Key Indicators of Bullish Futures Markets
- Strong economic data supporting growth.
- Rising prices with high volume.
- Positive news, lower interest rates, strong demand.
Key Indicators of Bearish Futures Markets
- Weak economic reports.
- Falling prices with increasing volume.
- Geopolitical risks, higher interest rates, oversupply in commodities.
Practical Example:
Bullish Scenario:
- S&P 500 futures are forming higher highs.
- RSI at 40 (not overbought).
- Price above the 50-day MA.
- Volume rising with price.
Bearish Scenario:
- Crude oil futures making lower lows.
- RSI at 75 (overbought).
- Price below 200-day MA.
- Bearish candlestick pattern forms.
Conclusion
Determining if futures are bullish or bearish involves more than just watching price movements. By combining trend analysis, indicators like RSI and moving averages, and volume studies, traders can gauge futures market sentiment with greater confidence. Reading charts effectively helps in identifying opportunities and avoiding risks in volatile markets.
FAQs about Futures Market Sentiment
1. Can futures markets change sentiment quickly?
Yes, futures markets can shift from bullish to bearish rapidly, especially after major news or economic events.
2. How accurate are technical indicators in showing sentiment?
They are useful tools, but should be combined with volume and price action for confirmation.
3. What is the best timeframe to read sentiment?
Daily charts are good for overall sentiment, but intraday traders may use 5-min to 1-hour charts.
4. Do news events affect market sentiment?
Yes, news like Fed decisions, earnings, or geopolitical events heavily influence sentiment.
5. Is sentiment analysis better than fundamental analysis?
Both are important. Sentiment shows current trader behavior, while fundamentals indicate long-term value.