Commodity futures charts are essential tools for traders looking to analyze and trade markets like oil, gold, natural gas, silver, and agricultural products. These charts reflect global supply-demand dynamics and are influenced by economic, political, and seasonal factors.
This guide explains how to read commodity futures charts and what traders should watch for when analyzing major commodities.
Key Commodity Futures Markets to Watch
- Crude Oil (CL Futures)
- Gold (GC Futures)
- Natural Gas (NG Futures)
- Silver (SI Futures)
- Corn, Soybeans, Wheat (Agricultural Futures)
Why Commodity Futures Charts Matter
- Price Discovery: Determine fair value of raw materials.
- Hedging: Manage risk for producers and consumers.
- Speculation: Profit from price movements driven by global events.
How to Read Commodity Futures Charts
- Chart Type: Candlestick or bar charts are most common.
- Timeframes:
- Short-term: 5-min, 15-min for intraday trades.
- Long-term: Daily, weekly for trend analysis.
- Indicators to Use:
- Moving Averages (MA) for trend direction.
- Relative Strength Index (RSI) for overbought/oversold conditions.
- Volume to confirm price moves.
Crude Oil Futures Chart (CL)
- Watch for:
- OPEC decisions, U.S. inventories, geopolitical tensions.
- Support at key psychological levels like $70, $80.
- Strategy: Trend following during strong supply-demand imbalances.
Gold Futures Chart (GC)
- Watch for:
- Inflation data, interest rate trends, USD strength.
- Major support at $1,800, $2,000 zones.
- Strategy: Range trading during consolidation, breakout strategy during economic uncertainty.
Natural Gas Futures Chart (NG)
- Watch for:
- Weather forecasts, seasonal demand, storage reports.
- Key volatility during winter/summer months.
- Strategy: Seasonal patterns, short-term breakout trades.
Silver and Agricultural Futures
- Silver (SI):
- Correlated to gold but more volatile.
- Industrial demand and inflation impact.
- Agricultural (Corn, Soybeans, Wheat):
- Affected by weather, planting reports, and global demand.
- Watch USDA reports for market-moving info.
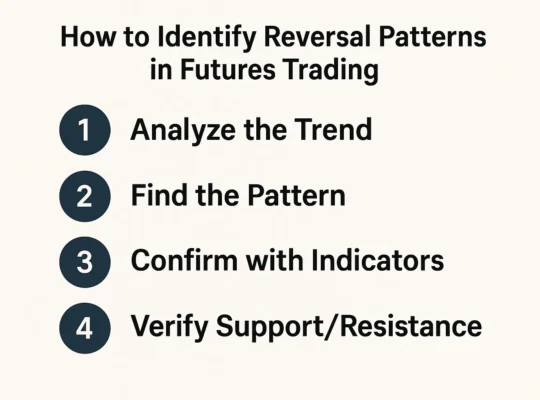
Common Patterns in Commodity Futures Charts
- Double Tops/Bottoms: Signal reversals.
- Triangles: Continuation or breakout setups.
- Head and Shoulders: Strong trend reversal indicators.
Tips for Analyzing Commodity Futures Charts
- Combine technical and fundamental analysis.
- Watch volume spikes for confirmation.
- Follow economic calendars for data releases impacting commodities.
Conclusion
Reading commodity futures charts like oil, gold, and agricultural products can provide crucial insights into market trends and trading opportunities. By understanding key price levels, patterns, and drivers, traders can make smarter decisions in the highly volatile commodities market.
FAQs about Commodity Futures Charts
1. Which commodity futures are most actively traded?
Crude oil, gold, natural gas, and agricultural products like corn and soybeans are among the most traded.
2. What affects commodity futures prices?
Supply-demand dynamics, geopolitical events, weather, and macroeconomic data.
3. Are commodity futures good for beginners?
They can be volatile, so beginners should start with strong risk management and focus on one market initially.
4. Can I trade commodity futures outside regular market hours?
Yes, most commodity futures trade nearly 23 hours a day with breaks depending on the exchange.
5. Which platforms offer commodity futures charts?
TradingView, Barchart, and Investing.com provide detailed commodity futures charting.