The ES futures chart is one of the most followed charts by traders around the world. It represents the S&P 500 E-mini futures, a derivative of the S&P 500 index, and is a key instrument for gauging market sentiment and executing trades in the U.S. stock market.
This guide will help you understand how to read the ES futures chart, its trading hours, and strategies to trade this highly liquid contract.
What Are ES Futures?
- Symbol: ES
- Full Name: E-mini S&P 500 Futures
- Exchange: CME (Chicago Mercantile Exchange)
- Contract Size: Represents 1/5 of the standard S&P 500 futures contract.
- Tick Size: 0.25 index points = $12.50 per tick.
ES futures are widely used for hedging, speculation, and gauging U.S. equity market trends.
Why Trade ES Futures?
- High Liquidity: ES futures have tight spreads, making them ideal for day trading.
- Leverage: Control a large position with relatively small margin.
- Extended Hours: Trade nearly 23 hours a day, five days a week.
- Market Influence: Reflects the performance of the 500 largest U.S. companies.
How to Read the ES Futures Chart
- Chart Type: Use candlestick charts for detailed price action.
- Timeframes:
- 1-min to 15-min for intraday trading.
- 1-hour to daily for swing trading.
- Key Indicators:
- Moving Averages (50, 200 MA) for trend direction.
- RSI for overbought/oversold conditions.
- Volume for confirmation of price moves.
Important ES Futures Trading Hours
- Regular Trading Hours (RTH): 9:30 AM – 4:00 PM EST.
- Globex Extended Hours: 6:00 PM – 5:00 PM EST (Sunday to Friday).
Note: Price action during pre-market and after-hours can be volatile with lower liquidity.
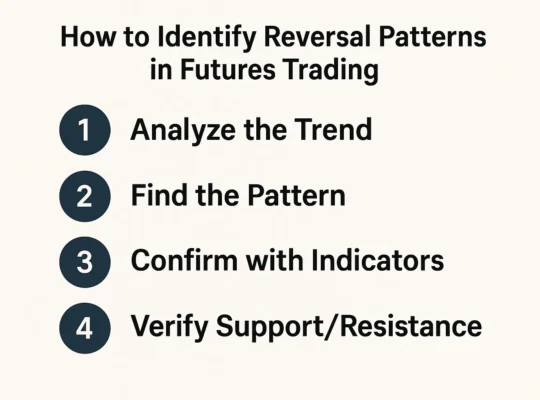
Key Levels on the ES Futures Chart
- Support and Resistance: Identify historical price levels where price reversed.
- Pivot Points: Calculate daily/weekly pivot levels for intraday decisions.
- Highs and Lows: Monitor recent swing highs and lows for breakout or breakdown signals.
Popular Strategies for Trading ES Futures
- Trend Following:
- Use moving averages to ride ongoing trends.
- Enter trades on pullbacks in the direction of the trend.
- Breakout Trading:
- Watch for price to break above resistance or below support.
- Confirm breakouts with volume spikes.
- Scalping:
- Focus on small, quick profits from minor price moves.
- Best in high-volume periods like market open.
- Range Trading:
- Trade between clearly defined support and resistance zones.
- Use oscillators like RSI or Stochastic for entry/exit.
Conclusion
The ES futures chart is a cornerstone of U.S. stock market trading. By understanding how to read its patterns, analyze price levels, and apply tested strategies, traders can take advantage of the liquidity and volatility the ES contract offers. Whether day trading or swing trading, mastering the ES futures chart can significantly enhance your trading performance.
FAQs about ES Futures Charts
1. What is the minimum tick size for ES futures?
The minimum tick size is 0.25 points, equivalent to $12.50 per contract.
2. Are ES futures good for beginners?
Due to high liquidity and leverage, ES futures can be suitable for experienced beginners with solid risk management.
3. How much margin is needed to trade ES futures?
Margin requirements vary but typically start around $500 to $1,200 for intraday positions with most brokers.
4. Can I trade ES futures 24 hours a day?
ES futures trade almost 23 hours a day, from Sunday 6 PM to Friday 5 PM EST, with a daily break.
5. Which platforms support ES futures charts?
Platforms like TradingView, Barchart, and NinjaTrader support ES futures charting.