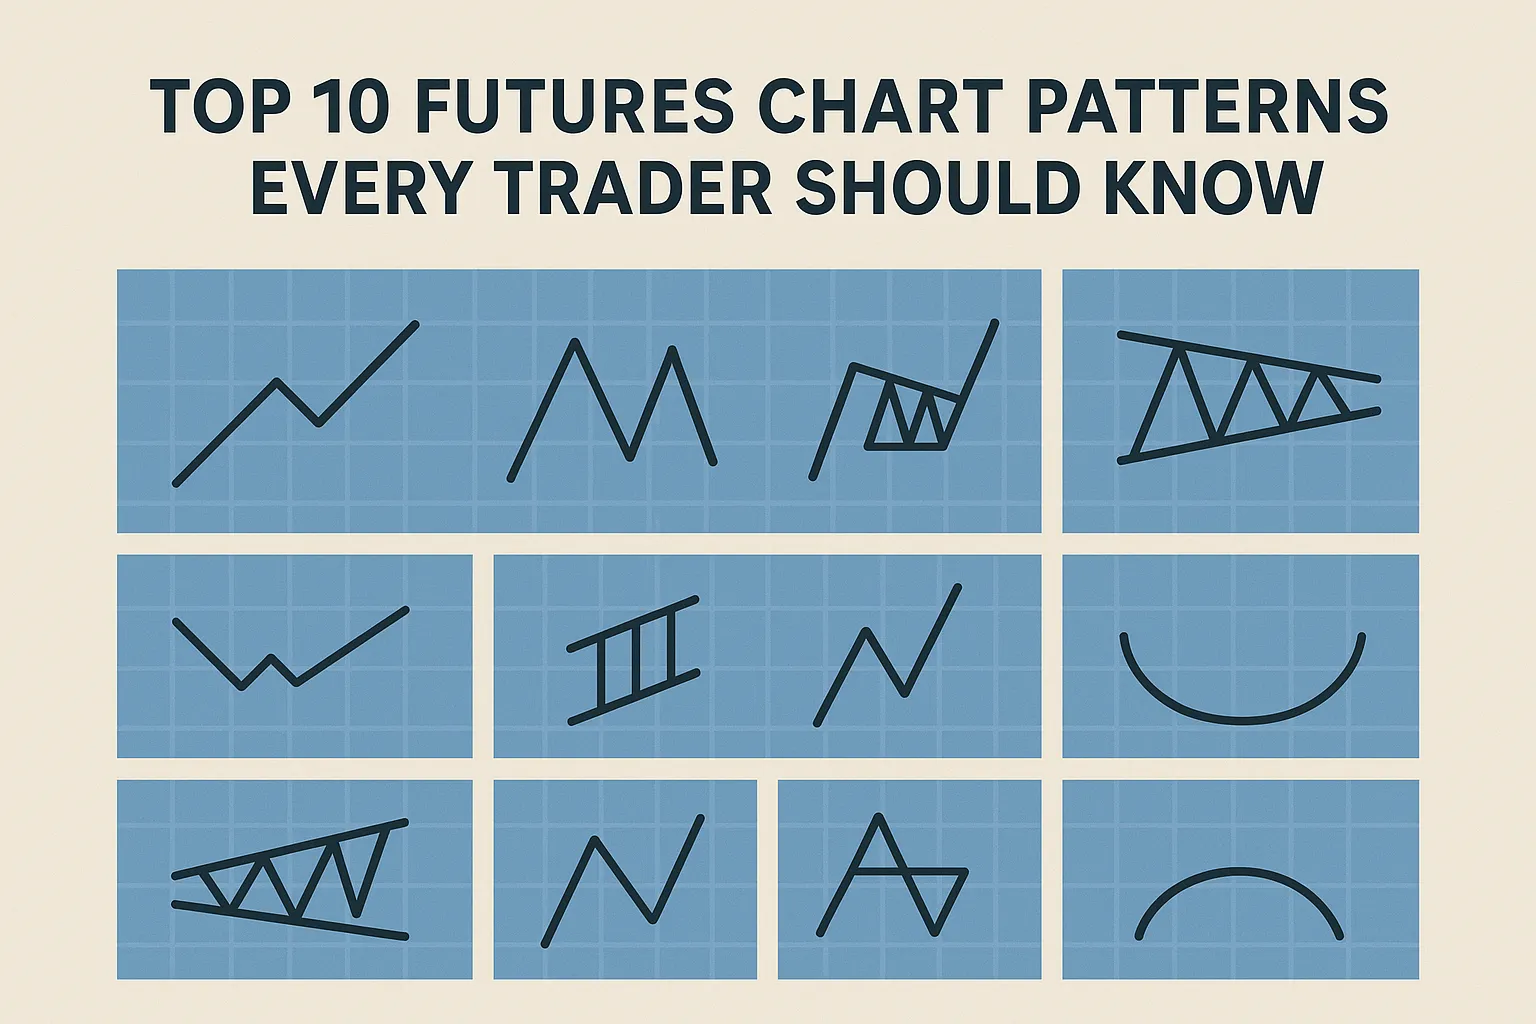
Top 10 Futures Chart Patterns Every Trader Should Know
Futures traders rely on futures chart patterns to identify market trends and predict potential price movements. These patterns provide insight into the behaviour of buyers and sellers, helping traders make informed decisions. Whether bullish or bearish, these chart formations are essential tools for anyone serious about futures trading.
Why Futures Chart Patterns Matter
Chart patterns are visual representations of price movements that repeat over time. Recognizing these patterns allows traders to:
- Anticipate price direction
- Set entry and exit points
- Manage risk more effectively
Top 10 Must-Know Futures Chart Patterns
1. Head and Shoulders
- Type: Bearish reversal
- What It Shows: A peak (shoulder), a higher peak (head), and a lower peak (shoulder) indicating a trend reversal from bullish to bearish.
- Futures Application: Signals the end of an uptrend.
2. Inverse Head and Shoulders
- Type: Bullish reversal
- What It Shows: Opposite of the head and shoulders, suggesting a shift from a downtrend to an uptrend.
3. Double Top
- Type: Bearish reversal
- What It Shows: Two peaks at a similar level indicating resistance, followed by a price decline.
4. Double Bottom
- Type: Bullish reversal
- What It Shows: Two lows at a similar level indicating support, followed by a price increase.
5. Ascending Triangle
- Type: Bullish continuation
- What It Shows: A rising support line with a flat resistance line. Price often breaks out upwards.
6. Descending Triangle
- Type: Bearish continuation
- What It Shows: A falling resistance line with flat support. Price often breaks downwards.
7. Symmetrical Triangle
- Type: Continuation
- What It Shows: Converging support and resistance lines. Breakout can occur in either direction.
8. Flag Pattern
- Type: Continuation
- What It Shows: A sharp price movement followed by a small rectangular consolidation, then a breakout in the same direction.
9. Pennant Pattern
- Type: Continuation
- What It Shows: Similar to a flag but with converging trendlines. Indicates a strong breakout after consolidation.
10. Cup and Handle
- Type: Bullish continuation
- What It Shows: A “U” shaped bottom followed by a slight downward drift (handle) before an upward breakout.
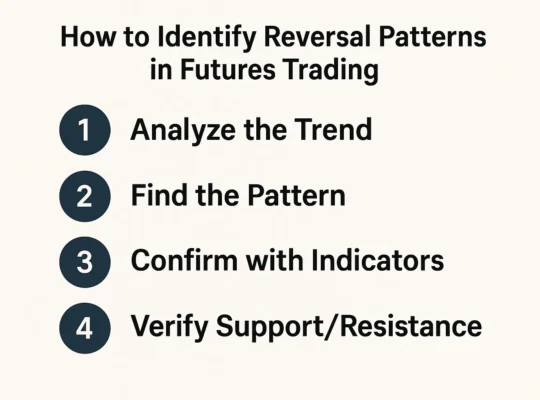
How to Use Chart Patterns in Futures Trading
- Confirm with Volume: Higher volume during a breakout increases the reliability of the pattern.
- Combine with Indicators: Use RSI, MACD, or moving averages for confirmation.
- Risk Management: Set stop-loss levels based on the pattern’s structure.
Conclusion
Learning these futures chart patterns gives traders a significant edge. Whether you’re spotting a reversal or preparing for a breakout, these patterns provide crucial insights into market dynamics. By mastering these 10 patterns, you can improve your timing, confidence, and profitability in futures trading.
FAQs about Futures Chart Patterns
1. Are chart patterns reliable in futures trading?
Yes, while no pattern is 100% accurate, these formations often repeat due to consistent trader behavior, especially when confirmed with other tools.
2. What is the most powerful chart pattern?
The Head and Shoulders pattern is considered highly reliable for spotting trend reversals.
3. How long does it take for a chart pattern to complete?
It varies—some patterns like flags may complete in hours, while others like cup and handle may take weeks.
4. Can chart patterns be used for intraday futures trading?
Yes, especially patterns like flags, triangles, and double tops/bottoms are useful for short-term trading.
5. Should I trade solely based on chart patterns?
No, always use chart patterns alongside other analysis tools and proper risk management strategies.